Query
You can use the Analysis | Query |
Query command  to view the boundary data that
meets specified criteria. Queries can be performed on multiple objects
across multiple layers. Queries require object data and/or object attribute(s), an operator, and an operand (condition).
In the Add to query string group,
you can select the object data, object attribute, operator, and an optional
function. See the Advanced
Tutorial - Lesson 3 for querying examples.

This
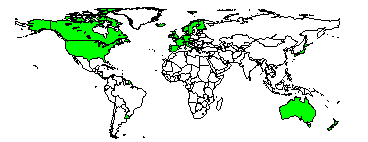
query [Life Expectancy 1997] > 75, shows life expectancy greater than
age 75
in
1997. The query action was to show only those countries that met the query
criteria. The outlines
of the other countries are shown as a base map on a separate layer.
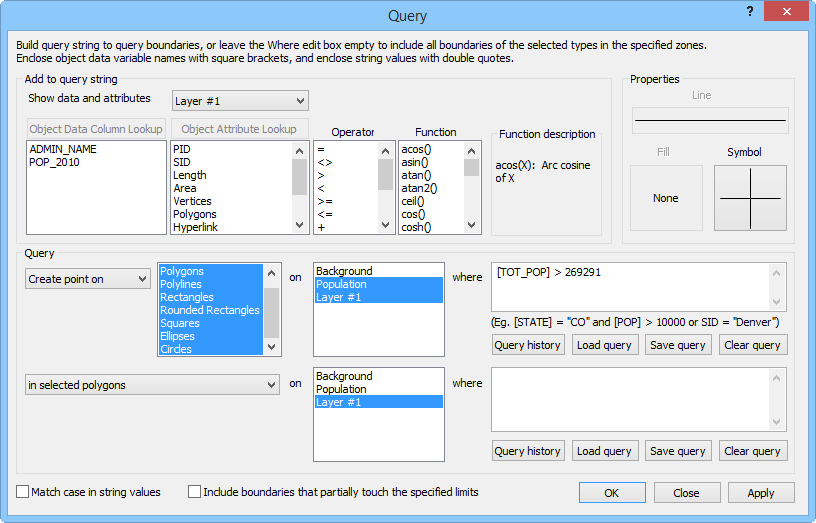
Query Dialog
The Query dialog allows you
to build a string to query boundaries. The boundaries can be queried by
data and/or attributes. Queries can be used to select, show, or apply
properties to objects. A query can also be used to create worksheets,
reports, layers, or points.

Build query strings, choose what action to perform with
queried objects, and select regions or areas to query with the Query
dialog
Add to Query String
In the Add to query string
group, you can select the object data, object attribute, operator, and
an optional function.
All
of the data file columns associated with the current map layer are
listed in the Object Data
list. The current map layer is selected in the Show
data and attributes on drop down box. You can
double-click a variable in the Object
Data list to search for object data in the map window. Alternatively,
you can enter the object data name into the Where
box. Enclose all object data names in square brackets if you choose
to enter the name. For example, if you have object data named POP
2000, enter it into the Where
box as [POP 2000].
Click
the Object Data Column Lookup
button to select an item from the selected data column. Double-click
on the item or click on the item and then click the OK
button to add it to the query.
If
you would like to search on object attributes, use the Object
Attribute list. This column includes all the items listed in
the Property Manager
Info tab including
the PID, SID,
Attrib1, Attrib2,
Length, Area,
Vertices, Polygons,
and Hyperlink. You can create
a query string to query for object data and object attributes, or
you can query for each one individually. Double-click on an object
attribute to add it to the Where
field. Alternatively, you can enter the object attribute name into
the Where box.
Click
the Object Attribute Lookup
button to select a from a list of the selected attribute. For example,
if PID is the selected object
attribute, clicking the Object Attribute
Lookup button allows you to select from a list of primary IDs
in the current layer. Double-click on the item or click on the item
and then click the OK button
to add it to the query.
Double-click
an operator in the Operator
list to add it to the Where
field. Alternatively, you can type the operator into the Where
box.
Click
a function in the Function
list to add it to the query string. Alternatively, you can type the
function name into the Where
box. A description of the function
appears in the Function description
group next to the Function
list. The trigonometric functions require angles in radians.
Query
The Query group contains options
for displaying the query results.
You can choose to Select, Show, Apply
properties to, Create worksheet
with, Create report with,
Create layer with, or Create
point on the queried boundaries.
Visible
boundaries that meet the criteria are selected if Select
is chosen.
If
you select Show, only boundaries
that meet the criteria are displayed on the map.
Apply properties to changes the
line properties,
fill properties,
and symbol properties
of the boundaries that meet the criteria. If you have a hatch or territory
map, the fill properties do not change the map since the hatch or
territory properties take precedence over fill properties. Density,
pie, bar, symbol, flow, and line graph maps all show with the specified
color in the boundaries. The symbol property change only applies to
pin maps. You can specify the queried object properties with the Line, Fill, and Symbol
buttons in the Properties
group.
Create worksheet with displays
the query results in a worksheet window. The worksheet contains all
of the available data for the boundary objects that meet the query
criteria.
Create report with creates a report
on queried objects similar to a Map
Document Report.
To
create a new map layer of the query results, choose Create
layer with.
Select
Create point on to create
a point on the boundaries meeting the criteria.
Select the type of object you wish to query with the Points,
Polygons, Polylines,
Rectangles, Rounded Rectangles,
Squares, Ellipses,
and Circles list. For example,
if you want to show all counties with a POP 2010 of greater than 500,000,
make sure Polygons box is selected.
If you have a pin map, make sure Points
is selected. Also, you can use this list to select objects of the specified
type without building a query. For example, if your map contains polygons,
points, and polylines, and you want to select all the points on the map,
select Points, leave the Where field blank, and click the
OK button to select all the points
on the map. The Arrange | Select
by Object command can be used for this purpose as well.
You can select which layers to query in the on
list. Click on layers to select or deselect them.
You can further define
the scope of your selection by choosing an option from the In
list.
Select
the in buffered areas option
if you would like to apply the query to objects within the defined
buffer area only. Check the Include
boundaries that partially touch the specified limits option
to include boundaries that are not fully included in the defined buffer
area.
Select
the in buffer zones option
if you would like to apply the query to objects within the defined
buffer zone only. Check the Include
boundaries that partially touch the specified limits option
to include boundaries that are not fully included in the defined buffer
zone.
Select
the in regions option if
you would like to apply the query to objects within the defined
region only. Check the Include
boundaries that partially touch the specified limits option
to include boundaries that are not fully included in the defined region.
If
in map is selected, all boundaries
or pins on the map meeting the criteria are selected, displayed, or
emphasized with property changes (see above).
Select
in selected polygons to apply
the query to objects within the selected polygons only. Check the
Include boundaries that partially
touch the specified limits option to include boundaries that
are not fully included in the selected polygons.
Select
touched by selected polylines
to query objects that touch selected polylines.
Select
the in polygons option to
query objects contained within polygons. Check the Include
boundaries that partially touch the specified limits option
to include boundaries that are not fully included in the polygons.
Select
touched by polylines to
query objects intersected by polylines on the map.
Where Box
The Where box contains the
query. The conditions of the query are typed directly into the Where
box. For example, if you want to show all counties with a POP 2000 of
greater than 500,000 you can build the [POP 2000] > portion of the
query in the Add to query string
group, then you need to type 500000 into the Where
box. You can use the * and ? wild card characters in the query.
* substitutes for any number
of characters in the specified position. For example, [COUNTY] = " A*" returns all counties beginning with the letter
A. All characters after the * are ignored. For example, " A*" and " A*C*"
return the same results.
? substitutes for a single
character in the specified position. For example, [COUNTY] = "C???"
returns all four letter county names beginning with the letter C.
Match Case
Check the Match case in string values
box to make the query case-sensitive.
Query History
Queries are stored in the Query History
dialog so that you may reuse queries. To access a previously written query,
click the Query History button
and select it from the Query History
dialog. The last 15 queries are saved in the query history.
Saving and Loading Queries
If you plan to perform a query more than once, it may be useful to save
the query for future use. To do this, create the query in the Query
dialog and then click the Save Query
button. This opens the Save As
dialog. Saved queries are stored as Map Query [.MQE] files. To use a saved
map query, click the Load Query
button and select a Map Query [.MQE] file.
Clear Query
The contents of the Where box
are retained in the dialog between MapViewer
sessions. If you would like to delete the contents of this box, click
the Clear Where Edit Box button,
or highlight the contents of the Where
box and press the DELETE button on your keyboard. Use the Save
Query button to save a query you have created, and click the Load Query
button to load a query a Map Query File [. MQE].
Performing the Query
Click the OK button to
perform the query and close the Query
dialog. Click the Close
button to close the Query
dialog without performing a query. Click the Apply
button to perform the query without closing the Query
dialog. The Apply
button is useful when you need to perform multiple queries and do not
need to return to the plot window. If you use Apply
to perform all desired queries, you should click Close to close the Query dialog. Clicking OK will duplicate the most
recent query.
Data
If you would like to see the data associated with selected objects,
use Analysis | Make
Report | Records Report | Boundary . Alternatively, you can use Create worksheet with.
Example
Open a new plot window
and import ny2000.gsb.
Load county data with the Home
| Data | Load command, and select ny2000.dat in the Open
Data File dialog.
To show all counties with a population greater than 500,000:
1. If
there are any queries in the Where
box, click the Clear Where Edit Box
button.
2. Double-click
on POP 2000 in the Variable
list in the upper left corner of the dialog. [POP
2000] is added to the Where
box.
3. Double-click
on the greater than sign (>) in the Operator
list. > is added to the Where
box after [POP 2000].
4. Type
500000 into the Where
box after the greater than sign. Note that you cannot include thousands
separators (commas) in the number.
5. Choose
the type of action, Select, in
the Query group.
6. In
the next box, highlight Polygons.
7. Select
in map from the In
field.
8. Click
the OK button and the areas with
population values greater than 500,000 are selected. The number of selected
areas appears in the status bar.

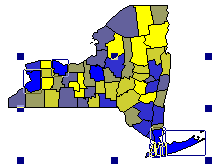
The
counties with a population greater than 500,000
are
selected using the query described in the example.
See Also
Query within Range
Query Map Data
Boundary
Records
Records in Regions
Analysis Tab Commands
 to view the boundary data that
meets specified criteria. Queries can be performed on multiple objects
across multiple layers. Queries require object data and/or object attribute(s), an operator, and an operand (condition).
In the Add to query string group,
you can select the object data, object attribute, operator, and an optional
function. See the Advanced
Tutorial - Lesson 3 for querying examples.

