Bar Map
 Bar maps represent
one or more data items side-by-side in a bar chart format. The height
of each bar is proportional to the associated data value. The position
of the bar chart is relative to the polygon, polyline, or point centroid.
Centroids may be moved using the Move
Centroids command.
Bar maps represent
one or more data items side-by-side in a bar chart format. The height
of each bar is proportional to the associated data value. The position
of the bar chart is relative to the polygon, polyline, or point centroid.
Centroids may be moved using the Move
Centroids command.
Bar maps can be made for polygons, polylines, or points.
For
polygons, the bar charts are drawn at the polygons's centroid (geographic
center). The polygons use the default fill and line properties, or
you can set unique fill and line properties for each area on the map.
For
polylines, the bar charts are drawn at the midpoint along the polyline.
For
points, the bar charts are drawn directly on top of the points.
Creating and Editing a Bar Map
Click the Map | Create Map | Bar
command  to create a bar map. Edit bar map properties
in the Property Manager.
to create a bar map. Edit bar map properties
in the Property Manager.
See Creating
and Editing Thematic Maps for information on creating a map, changing
a map to another map type, and changing map properties.
Bar Map Properties
The Property Manager
for a bar map contains General, Data Labels, Info,
Bars, Bar Labels,
3D Settings, and Map
pages. Click the preceding hyperlinks for information on properties in
each of the property manager pages.
Map Page
The bar map Property Manager
Map page contains general bar
style, size, and position properties. See the Bars
page for variable specific bar properties.
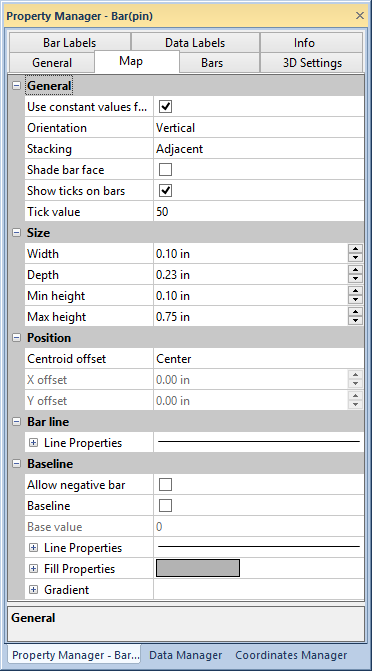
Change bar map properties in the Map page
of the
Property Manager.
General
The General section of the
Map page properties control the
general bar properties in a bar map.
Click the Use constant values for
all variables to use the same relative sizes for all data variables
represented on the map. The Use constant
values for all variables options should be checked when data values
are related and/or have the same approximate magnitude. Differences between
data in the smaller data columns are not easily discernible when Use constant values for all variables
is clicked. When Use constant
values for all variables is active, size, tick, negative bar, and
baseline properties for all variables are edited on the Map
page.
If the Use constant values for all
variables property is not active, the bars are scaled relative
to their individual variable data. Size, tick, negative bar, and baseline
properties are edited for each variable in the Bars
page.
Select a Vertical or Horizontal bar direction in the
Orientation list.
Select Stacked or Adjacent
in the Stacking list to stack
the bars or show them side by side.
Click the Shade bar face check
box to apply shading to the bar face.
Click the Show ticks on bars
check box to add reference tick marks to the bars. If Show
ticks on bars and Use constant
values for all variables is active, the Tick
value can be changed by typing a number into the Tick
value box. If Use constant values
for all variables is not checked, the tick value is edited for
each variable independently on the Bars page.
Size
The Size section specifies
the Width, Depth,
Min height, and Max
height for the bars. The Size
properties are only available on the Map
page when Use constant values for all
variables is checked. If different values are used for each variable,
the bar size properties for each variable are edited in the Bars
page. The Width and Depth
fields change the size of all the displayed bars. The Min
height value is applied to the minimum data value for all variables
used in the bar map. The Max height
value is the height of the bar corresponding to the largest data value
for all variables used in the bar map. The remaining bars are sized proportionally
between the minimum and maximum bar heights. Type a
number in page units into one of the size fields or click the  buttons to change the bar
size.
buttons to change the bar
size.
Position
Select the bar position by clicking Center,
Left, Right,
Above, Below,
or User Defined in the Centroid offset list. Selecting
User Defined enables editing
in the X offset and
Y offset boxes. Type a value in page units into the X
offset and Y offset fields
or click the buttons
to move the bar position relative to the object centroids. Object centroids
can be moved with the Move
Centroids command.
Bar line
Change the bar line properties in the Bar
line section of the Map
page. See the line properties
help page for more information on editing line properties.
Baseline
The Baseline section of the
Map
page contains properties to show a baseline, set the base value,
and edit baseline line and fill properties. Click the Allow
negative bar check box to allow bars to grow in the opposite direction
(down for Vertical bars, left
for Horizontal bars) for negative
data values. When Allow negative bar
is not active, data value difference from the data minimum is represented
by the bar height. When Allow negative
bar is checked, the data value difference from the Base
value is represented by the bar height.
Click the Baseline button to
show a baseline on the bar charts
The Base value field sets the
base value when Allow negative bar
and Use constant values for all variables
are active. The Base value can
be set by typing a number into the Base
value field. If constant values are not used for variables, edit
individual variable base values in the Bars
page. When Allow negative bar
is not checked the Base value
is disabled and set at the minimum data value.
See the line properties
and fill properties pages
for more information on editing baseline line and fill properties. Apply
a gradient fill to the baseline by selecting Linear
or Radial from the Type
list. Click on the Colormap selection
to pick a predefined colormap for the gradient, or click the  button to create a custom
colormap in the Colormap
dialog. Select a Vertical,
Horizontal, Inward, or Outward
gradient direction in the Gradient
Direction list.
button to create a custom
colormap in the Colormap
dialog. Select a Vertical,
Horizontal, Inward, or Outward
gradient direction in the Gradient
Direction list.
See Also
Bars Page
Bar Labels Page
3D Settings Page - Bar Maps
Legend
Property Manager