Symbol Map
 Symbol maps
display a scaled symbol proportional to the boundary object's associated
data value. Bivariate data can be displayed by varying symbol color from
a separate data column. The symbols may be repositioned relative to the
boundary object by using the Move
Centroids command.
Symbol maps
display a scaled symbol proportional to the boundary object's associated
data value. Bivariate data can be displayed by varying symbol color from
a separate data column. The symbols may be repositioned relative to the
boundary object by using the Move
Centroids command.
Symbol maps can be made for polygons, polylines, or points.
For
polygons, the scaled symbols are drawn at the area's centroid (geographic
center). The areas use the default fill and line properties, or you
can set unique fill and line properties for each area on the map.
For
polylines, the scaled symbols are drawn at the midpoint along the
curve.
For
points, the scaled symbols are drawn directly on top of the point
symbol. If the scaled symbols are open, like an open circle with no
fill, you can see the point symbol beneath the symbol map symbol.
To avoid this, disable the display of the point symbol by selecting
the symbols and changing the color
to white. The symbol map symbols are still drawn, but the point
location symbols are not visible. Alternatively, you can use the View | Show Objects
command and turn off the display of the point symbols by unchecking
the Symbol box and then checking
the Theme of hidden object
box. The symbol map symbols are still drawn, but the point location
symbols are not displayed.
Creating and Editing a Symbol Map
Create a symbol map by selecting a layer with linked boundary objects.
Then, click the Map | Create Map | Symbol
command  .
.
See Creating
and Editing Thematic Maps for information on creating a maps, changing
a map to another map type, and changing map properties.
Symbol Map Properties
You can set the symbol type as well as other options in the Property
Manager. The Property Manager
for a symbol map contains General,
Symbol, Data
Labels, Info, and
Map pages. Click the preceding
hyperlinks for information on properties in each of the property manager
pages.
Map Page
Properties that are unique to symbol maps are edited on the Map
page of the Property
Manager.
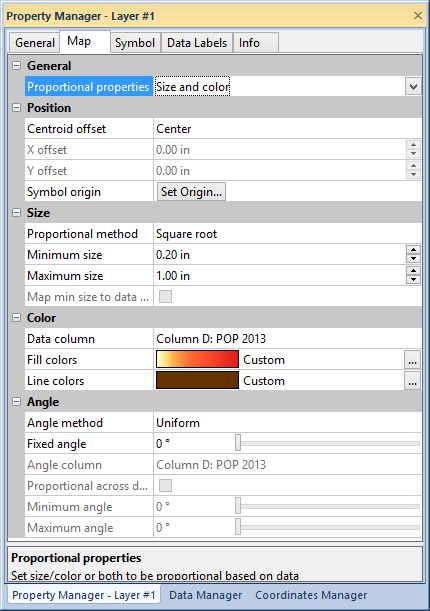
Edit symbol map properties in the Map
page of the Property Manager.
General
The Proportional
properties list selects which properties
are proportional to the data in the Variable
column on the General page. You
can select Size, Color, or Size and color
in the Proportional properties
list.
Position
The centroid is the geographic center of an polygon, the midpoint along
a polyline, or the location of a point. The centroid location can be moved
for all polygons, polylines, or points. The Centroid
offset is used to offset each symbol from its corresponding position.
Center, Left,
Right, Above,
and Below position the symbol
in the specified direction. User defined
enables the X and Y boxes so you can enter any arbitrary offset amount.
The offsets must be specified in page units.
Click the Origin button to
specify the origin of the symbol. The symbol is positioned, rotated, and
scaled about the origin. Clicking the Origin
button displays the Symbol Origin dialog with
some cross hairs in a box. The intersection of the cross hairs represents
the symbol origin, and the box represents the limits of the symbol. Use
the horizontal and vertical scroll bars to position the origin
Size
Symbol size Proportional method
is used to determine the relative size of the symbols. Linear
makes the height and width of each symbol directly proportional to its
data value, while Square root
makes them proportional to the square roots of their values. Linear
should be used if your symbol is very narrow (like a bar), since it results
in each symbol's height being proportional to its data value. Otherwise,
Square root should be used, since
it results in the symbol's area being proportional to its data value.
Studies show the viewer mentally compares the areas of two symbols and
not their heights.
The box containing symbol size and data values allows you to specify
how much the symbols are scaled. Enter a minimum value into the Minimum size field, and a maximum
value into the Maximum size field.
The smallest data value is drawn with the minimum width and height. The
largest data value is drawn with the maximum width and height. All data
values in between are scaled proportionally. You can use the arrows to
increase or decrease each value, or type the size you want. The size is
specified in page units.
Click the Map min size to data value
of 0 check box to associate the minimum symbol size with a data
value of zero. The Use absolute data
value option must be activated on the General
page of the Property Manager for
the Map min size to data value of 0
property to be available.
Color
Select the data column for proportional color in the Data
column list.
Select fill and line colors by clicking on the color bar next to either
Fill colors or Line
colors. Click the  to open the Colormap dialog
and create a custom colormap for the line or fill.
to open the Colormap dialog
and create a custom colormap for the line or fill.
Negative Data
When Size is the selected Proportional properties item, the
Negative Data group is available.
The Negative Data options specify
a color for negative data values if desired. Click the Specify
color for negative values check box to make symbols with negative
values a separate color. Click the Fill
color or Line color lists
to select a color in the Color
Palette. Click the
buttons to open the Colors
dialog and select a custom color.
Angle
Symbols can be rotated in a symbol map uniformly or by using information
in a column in the data file. The symbol rotation can be entered as angles
(degrees) or the angle information can be calculated based on the column's
data in relation to the minimum and maximum angle values.
Select either Uniform or From data in the Angle
method list. The Uniform
angle method applies one angle to all the symbols in the map. Use the
slider bar  to change the symbol angle.
When From data is selected,
symbol angles are specified by an angle column or proportional to data
values in the specified data column. Select the data column for specified
angles or proportional angles in the Angle
column list. The Angle column
should contain numeric values in degrees if Proportional
across data is not checked.
Click the Proportional across data
check box if the Angle column
contains map data and not specific symbol angles in degrees. Use the slider
bar to set the Minimum
angle rotation for the smallest data value symbol. Use the slider
bar to set the Maximum
angle rotation for the largest data value symbol. The remaining
symbols are rotated in proportion to the minimum and maximum values and
their symbol angles.
See Also
Legend
Map Types
Property Manager