Pie Map
 Pie maps are
used to represent multivariate data by drawing a proportionally sized
pie chart for polygon, polyline, or point. Pie charts show two or more
variables where each variable is represented by a proportionally sized
slice of the pie. Up to 20 variables can be displayed on a pie map. Within
a single pie, the size of the slices gives you the relative proportion
of the values for that object. The entire pie chart is sized in relation
to the total of all variables for a particular boundary, as compared to
the totals of the variables for other boundaries. The position of the
pies relative to the polygon, polyline, or point may be moved with the
Move Centroids command.
Pie maps are
used to represent multivariate data by drawing a proportionally sized
pie chart for polygon, polyline, or point. Pie charts show two or more
variables where each variable is represented by a proportionally sized
slice of the pie. Up to 20 variables can be displayed on a pie map. Within
a single pie, the size of the slices gives you the relative proportion
of the values for that object. The entire pie chart is sized in relation
to the total of all variables for a particular boundary, as compared to
the totals of the variables for other boundaries. The position of the
pies relative to the polygon, polyline, or point may be moved with the
Move Centroids command.
For
polygons, the pie charts are drawn at the area's centroid (geographic
center). The areas use the default fill and line properties, or you
can set unique fill and line properties for each area on the map.
For
polylines, the pie charts are drawn at the midpoint along the polyline.
For
points, the pie charts are drawn directly on top of the points.
Creating and Editing a Pie Map
Click the Map | Create Map | Pie
command  to create a pie map. Edit pie map properties
in the Property Manager.
to create a pie map. Edit pie map properties
in the Property Manager.
See Creating
and Editing Thematic Maps for information on creating a pie map, changing
a bar map to another map type, and changing map properties.
Pie Map Properties
The Property Manager
for a pie map contains General, Data Labels, Info,
Pies, 3D Settings,
Pie Labels, and Map pages. Click the preceding hyperlinks
for information on properties in each of the property manager pages.
Map Page
The Property Manager
Map page has size, position, and
display properties for a pie map.
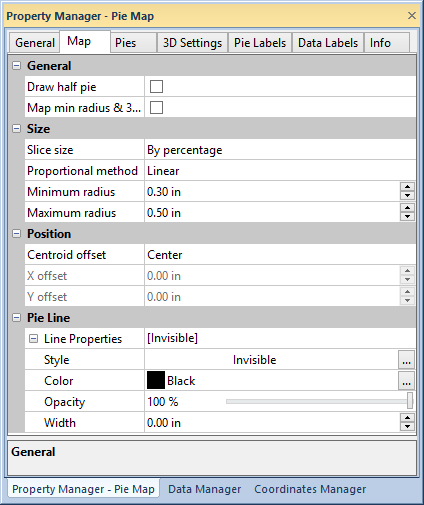
Edit pie map properties in the Map
page of the Property Manager.
General
The General section of the
Map page has display options for
the pie map. Click the Draw half pie
check box to display a half pie chart. The half pie is not the default
pie chart cut in half. Rather, in a half pie chart, the pie slices are
proportions of half a circle, or cylinder for 3D pie charts.
Click the Map min radius & 3D
height to a value of 0 to force the minimum radius or height to
a data value of zero regardless of the data minimum.
Size
Change the pie map sizes in the Size
section of the Map page. Select
the feature of the pie map to vary with the data value in the Slice
size list; click By percentage,
By radius, or By
radius and percentage. By percentage varies the area of the pie
slices, and By radius
varies the radius of the slices to represent the data value. When By percentage is selected the pie
radius represents the total value of the pie. The By
radius and By radius and percentage
options only show the relationship of slices for each pie and does
not show total pie values relative to each other.
Select Linear in the Proportional method list to scale
the pie radiuses with the By percentage
method, or slice radiuses with the By
radius method, linearly between the minimum and maximum data values.
Select Square root to scale the
radii proportionally to the square root of the data values.
Set the Minimum radius and
Maximum radius by typing a number
in page units into the Minimum radius
and Maximum radius fields. The
radiuses can also be adjusted by clicking the  buttons.
When By percentage is the Slice size, the pie with the smallest
total value is sized with the Minimum
radius, and the pie with the largest total value is sized to the
Maximum radius. The remaining
pies are scaled between the two radiuses by the Propportional
method. When By radius
is selected, the smallest data value for each slice is represented by
the Minimum radius, and the largest
data value for each slice is represented by the Maximum
radius. The remaining slices of each pie are scaled by the Proportional method.
buttons.
When By percentage is the Slice size, the pie with the smallest
total value is sized with the Minimum
radius, and the pie with the largest total value is sized to the
Maximum radius. The remaining
pies are scaled between the two radiuses by the Propportional
method. When By radius
is selected, the smallest data value for each slice is represented by
the Minimum radius, and the largest
data value for each slice is represented by the Maximum
radius. The remaining slices of each pie are scaled by the Proportional method.
Position
The centroid is the geographic center of an polygon, the midpoint along
a polyline, or the location of a point. The centroid location can be moved
for objects with the Move
Centroids command. The Centroid
offset is used to offset each pie from the centroid position. Center, Left,
Right, Above,
and Below position the pie in
the specified direction. User defined
enables the X offset and Y offset boxes so you can enter
any offset amount. Type a value in page units into the X
offset and Y offset fields
or click the to set
the offset values for a User defined
Centroid offset.
Pie Line
Edit line properties for the lines between slices and around the circumference
in the Pie line section of the
Map page. See the line
properties help page for more information on editing pie line properties.
See Also
3D Settings Page - Pie Maps
Pies Page
Pie Labels Page
Property Manager
Legend