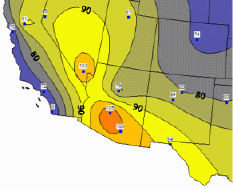
 Contour maps interpolate from discrete
data values to create a regularly-spaced grid. The grid is displayed as
lines of constant data values. The areas between the lines may be
filled with colors and patterns of your choice.
Contour maps interpolate from discrete
data values to create a regularly-spaced grid. The grid is displayed as
lines of constant data values. The areas between the lines may be
filled with colors and patterns of your choice.Contour maps interpolate from discrete
data values to create a regularly-spaced grid. The grid is displayed as
lines of constant data values. The areas between the lines may be
filled with colors and patterns of your choice.
Create a contour map by selecting a layer with linked boundary objects,
then clicking the Map | Create Map |
Contour command  . Edit
contour maps in the Property
Manager.
. Edit
contour maps in the Property
Manager.
See Creating and Editing Thematic Maps for an example of creating a map, editing the map, and changing the map to another type.
The Property Manager for a contour map contains General, Gridding, Data Labels, Info, and Map pages. Click the preceding hyperlinks for information on properties in each of the property manager pages.
Edit properties unique to contour maps in the Map page of the Property Manager.
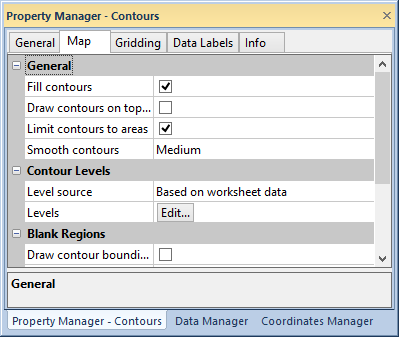
Edit contour map properties in the Map page of the Property Manager.
The general group contains general contour options.
Click the Fill contours check box to apply a fill to the contours. Change the fill properties in the Levels dialog.
Click the Draw contours on top of layer check box to draw the contours on top of the objects in the contour map layer. Boundary objects in the contour map will not be visible if Draw contours on top of layer is active. Boundary objects on another layer can overlay the contour map by moving the layer above the contour map in the Object Manager.
Click the Limit contours to areas check box to limit contours to the boundaries of the objects on the contour map layer. Overlapping objects will create lakes, or holes, in the contour map. When Limit contours to areas is not active, contours fill the bounding box of all objects on all layers.
Select a level of contour smoothing in the Smooth contours list. Click on the smoothing level and select None, Low, Medium, or High.
Select the data source for classification in the Level source list. Select Based on worksheet data to use the linked data sheet to determine contour level classes. Select Based on grid nodes to determine contour level classes with grid nodes.
Click the  button to edit
contour levels in the Levels dialog.
button to edit
contour levels in the Levels dialog.
Show the contour bounding box and edit its line and fill properties in the Blank Regions group.
Click the Draw contour bounding box check box to show the bounding box. Activating Draw contour bounding box deactivates Limit contours to areas, extends the contours to the extent of the bounding box, and makes the line and fill properties available.
Click the  button to expand
the line, fill,
or gradient properties.
button to expand
the line, fill,
or gradient properties.
Select a gradient type, colormap using the, and direction to apply a
gradient to the fill. Make a custom colormap in the Colormap
dialog by clicking on the  button.
See Also