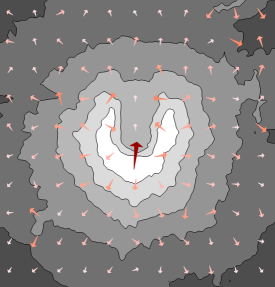
 Vector maps interpolate from discrete
data values to create a regularly-spaced grid. Vectors are drawn to show
the direction and magnitude of the steepest slopes across the grid.
Vector maps interpolate from discrete
data values to create a regularly-spaced grid. Vectors are drawn to show
the direction and magnitude of the steepest slopes across the grid.Vector maps interpolate from discrete
data values to create a regularly-spaced grid. Vectors are drawn to show
the direction and magnitude of the steepest slopes across the grid.
Click the Map | Create Map | Vector
command  to create a vector map. Edit vector map
properties in the Property
Manager.
to create a vector map. Edit vector map
properties in the Property
Manager.
See Creating and Editing Thematic Maps for information on creating a map, changing a map to another map type, and changing map properties.
The Property Manager for a vector map has General, Gridding, Data Labels, Info, and Map pages. Click the preceding hyperlinks for information on properties in each of the property manager pages.
The Property Manager Map page for vector maps contains vector style, size, limits, line, and fill properties
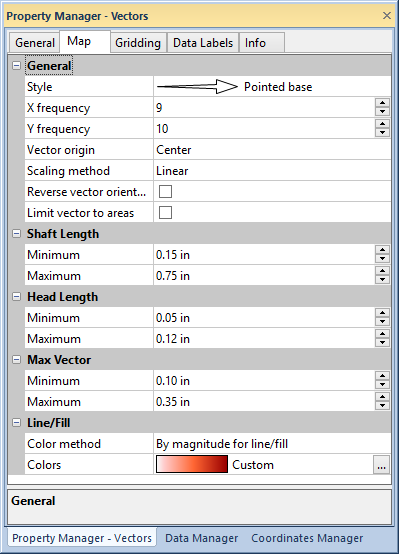
Change vector properties in the Map page of the Property Manager.
The General group properties control the vector style, frequency, location, and scale.
Click the vector Style to select a style from the vector palette.
The X frequency and
Y frequency values are the number of grid nodes skipped between
plotted vectors. Increasing the value increases the distance between vector
origins, and decreasing the value decreases the distance between vectors.
Type a number into the X frequency
or Y frequency box, or adjust
the value by clicking the  buttons.
Select the Vector origin by clicking on the current option and selecting Tail, Center, or Head from the list.
Select the Scaling method by clicking on the current option and selecting Linear, Square root, or Logarithmic from the list. All of the options are proportionally scaled to the data values in the Variable column selected on the General page. The Linear method scales the vectors to the data values and is best for data in a small range. The Square root method scales vectors to the square root of the data values, and the Logarithmic method scales vectors to the log of the data values. For large data ranges use the Square root method, and for very large data ranges use the Logarithmic method to scale the vectors.
Click the Reverse vector orientation check box to reverse the vector direction without changing the symbol or origin.
Click the Limit vector to areas check box to limit the vectors to the area defined by the base map
The Shaft Length, Head
Length, and Max Vector
groups set the minimum and maximum vector length (Shaft
and Head Length) and width (Max Vector). The vector associated
with the smallest data value is sized by the Minimum
fields. The vector associated with the largest data value is sized by
the Maximum fields, and
the remaining vectors are scaled proportionally between the two based
on the Scaling method. The Minimum and Maximum
fields are in page units. Change the values by typing a number into the
boxes or clicking the
buttons.
The Line/Fill group contains the Color method, line, and fill properties. Click the current Color method selection to open the list and select Classes for line, Classes for fill, Classes for line/fill, By magnitude for line, By magnitude for fill, By magnitude for line/fill, or Uniform.
The Color method property selects the vector line and/or fill properties determined by classes or magnitude. The property determined by the Color method is edited in the Vector Color Classes or Colormap dialog. The property not determined by the Color method is edited in the Property Manager. For example, if Classes for line is selected the fill properties are edited in the Property Manager and the line properties are edited in the Vector Color Classes dialog. Conversely, if By magnitude for fill is selected the line properties are edited in the Property Manager and the fill properties are edited in the Colormap dialog. If Classes for line/fill or By magnitude for line/fill is selected, then both properties are changed in the appropriate dialog.
If one of the Classes for...
options is selected, click the  button next to Classes to open
the Vector Color Classes dialog.
button next to Classes to open
the Vector Color Classes dialog.
If one of the By magnitude for...
options is selected, Click the current Colors
option and select a color spectrum from the Color
Spectrum list or click the  button to create a custom color spectrum in the Colormap
dialog.
button to create a custom color spectrum in the Colormap
dialog.
For more information on editing properties not determined by the selected Color method, see the line properties and fill properties help pages.
See Also