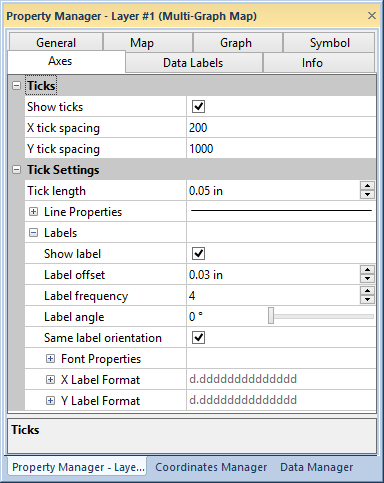
The Axes page of the Property Manager contains tick mark and axis label properties for multi-graph map line graph axes.
Edit tick mark and label properties in the Axes page of the Property Manager.
The Ticks section of the Axes page shows ticks and adjusts tick spacing. Click the Show ticks check box to display tick marks on the multi-graph map graphs. Type a value into the X tick spacing and Y tick spacing fields to set the tick mark spacing.
The Tick Settings section of the Axes page contains tick length and line properties. The Tick Settings section also displays labels and edits label font and format properties.
Adjust tick length by typing a value in page units into the Tick
length field or clicking the  buttons. See
the line properties help
page for more information on editing tick line properties.
buttons. See
the line properties help
page for more information on editing tick line properties.
Click the Show label check
box to show tick labels next to the tick marks. The distance labels are
drawn from the tick marks is set in the Label
offset field. Type a value in page units or click the buttons to change the offset
distance. The Label frequency
property determines how often labels are added to tick marks. A value
of "1" shows every tick mark label; a value of "5"
shows every fifth tick mark label. Type a number into the Label
frequency box or click the
buttons to change the label frequency. Labels can be rotated between 0
and 359 degrees. Type a value in degrees in the Label
angle field or click and drag the  bar to adjust
the label rotation. Click the Same label
orientation to orient both X and Y axis tick mark labels in the
same direction.
bar to adjust
the label rotation. Click the Same label
orientation to orient both X and Y axis tick mark labels in the
same direction.
Edit tick mark label font and format properties in the Font Properties and Label Format groups. The X Label Format and Y Label Format are edited independently. See the font properties and label format help pages for more information on editing tick mark label font and format properties.
See Also