 button in the Classes field of
the Map page in the Property
Manager.
button in the Classes field of
the Map page in the Property
Manager.The Classes dialog contains
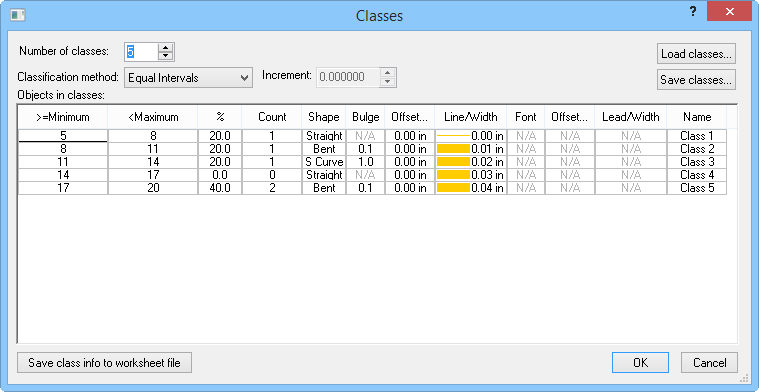
the classification method and properties for a flow map with Use
classes as the selected Data
method. The Classes dialog is opened by clicking the  button in the Classes field of
the Map page in the Property
Manager.

Set the number of classes and classification method, class minimum and maximums,
The Number of classes value is used to specify the number of classes or groupings on the map. This number is the number of classes displayed in the Objects in classes table. You can have up to 100 classes.
The Classification method specifies the method used to calculate the limits of the classes.
Equal Number assigns the class ranges so that an approximately equal numbers of flow lines are included in each class. In this case, the interval of each class is usually different.
Equal Intervals calculates the class limits such that the interval between the minimum and maximum of each class is equal. In this case, different numbers of flow lines might be assigned to each class. The Increment box is displayed when Equal Intervals is selected. This box shows the range covered by each bin.
Standard deviation generates data classes based on the standard deviation of the data. When the Standard deviation method is selected, the Increment field appears. The Increment field allows you to define the standard deviation increment to establish the class ranges and number of classes. The Increment and Number of classes values are dependent upon each other, so changing one value automatically changes the other.
The Jenks' Natural breaks method creates classes based on the optimal natural breaks in your data.
User Defined allows you to create your own class definitions. Overlapping or discontinuous classes are not allowed. Double-click on the minimum and maximum values in the Objects in classes list to define the classes after you define the Number of classes.
Once the classes are defined, they can be saved for reuse in a class file [.CLS]. Click the Save Classes button to save the classes. To use an existing class file, click the Load Classes button. You can also save the class information to a worksheet file by clicking the Save Class Info to Worksheet File button.
The Objects in classes group displays summary statistics and allows you to specify the properties for each class.
The >= Minimum list specifies the lower limit for each class of data. All values greater than or equal to this value are included in the class. You can double-click the number for any of the classes and change the value in the Class Limit dialog.
The <Maximum list specifies the upper limit for each class of data. All values less than the maximum value are included in the class. You can double-click the number for any of the classes and change the value in the Class Limit dialog.
The % column indicates the percentage of linked data in the particular class. This value cannot be edited and is for informational purposes only.
The Count column indicates the number of flow lines included in each class. This value cannot be edited and is for informational purposes only.
When the Method is set to Connect centroid, the Shape column sets the shape of the flow map lines. S Curve creates a flow similar to the shape of the letter "S." Bent creates lines that consist of a single arc that extends from the start centroid to the end centroid. Straight draws straight lines from the start centroid to the end centroid. Double-click on the shape type for each class to change the flow line shape.
When the Method is set to Connect centroid, Bulge determines the exaggeration of the flow line shape for S Curve or Bent lines. Negative bulge values create downward flowing bent lines, while positive values create bent lines flowing upward. Negative bulge values reverse the shape of S flow lines. Bulge values range from -1 to +1. Double-click on the bulge value for each class to change the flow line exaggeration. Increasing Bulge increases the curve in a Bent flow and decreases the curve in an S Curve flow.
The Offset (Flow) defines the distance from the end of the flow line to the centroid. This is useful if you wish to place an arrow head on the end of the flow line or if you do not want to interfere with object labels. An Offset value of zero places the ends of the flow lines directly on the centroids. A higher Offset value moves the ends of the flow lines away from the centroid. When the Offset value is increased, the flow line is moved in the direction of the starting object's centroid. The Offset value is a number between zero and 10 inches (zero and 25.4 cm). Double-click on the offset value for each class to change the value.
Double-click on a line sample in the Line/Width column to change the line properties. When using the Proportion option, the Line/Width column is disabled.
Double-click on the word Font in the Font column to change label font properties. If you are using the Connect centroids and Use classes methods, you can have a different font for each class. The Draw labels box must be checked before setting the font.
The Offset (Text) column controls the distance between the label and the line's centroid position when the Draw labels box is checked.
The leader line properties are opened by double-clicking on the line in the Leader/Width column. Lead lines are drawn when an offset is specified.
The Name column indicates the optional class title used in the legend.
See Also