Data metrics is an available gridding method. The collection of data metrics gridding methods creates grids of information about the data on a node-by-node basis. The data metrics gridding methods are not, in general, weighted average interpolators of the variable. For example, you can obtain information such as:
the number of data points used to interpolate each grid node. If the number of data points used are fairly equal at each grid node, then the quality of the grid at each grid node can be interpreted.
the standard deviation, variance, coefficient of variation, and median absolute deviation of the data at each grid node. These are measures of the variability in space of the grid, and are important information for statistical analysis.
The local data set is defined by the search parameters. These search parameters are applied to each grid node to determine the local data set. In the following descriptions, when computing the value of a grid node ( r, c), the local data set S(r, c) consists of data within the specified search parameters centered at the specific grid node only. The set of selected data at the current grid node (r,c), can be represented by S(r,c), where
where n = number of data points in the local data set
The Z(r,c) location refers to a specific node within the grid.
There are five groups of data metrics, Z Order Statistics, Z Moment Statistics, Other Z Statistics, Data Location Statistics, and Terrain Statistics.
Specifying Data Metrics Options
In the Property
Manager Gridding page, select Data Metrics
as the Gridding method and
then click the Advanced
Options  button to display the Data Metrics Options
dialog.
button to display the Data Metrics Options
dialog.
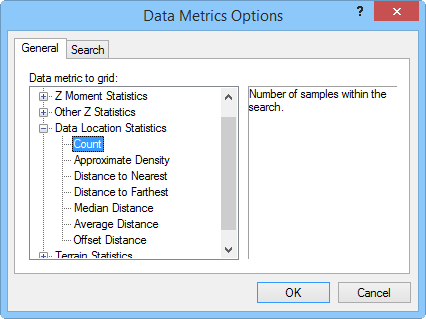
Select the data metric to grid in the Data Metrics Options dialog.
Planar Grids
Data metrics is used to provide information about your data. After information is obtained from data metrics, it is likely you will grid the data again using one of the other gridding methods. When using data metrics, you will usually want to use the same grid line geometry and search parameters as when you grid the data using another gridding method.
When using some data metrics, a horizontal planar or sloping planar grid is generated. This is usually a result of the selected search method. For example, consider using a boundary with 47 area centroids and the Count data metric. The Count data metric determines the number of data points used in determining the grid node value. Since the boundary contains 47 data points, No search (use all of the data) is the default search method. Using No search (use all of the data) means for each calculated grid node, all 47 points are used in determining the grid node value. The resulting data metric grid is horizontal planar because all grid nodes have a Z value of 47. The grid report shows both the Z minimum and the Z maximum as 47.
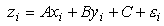
Other data metrics can yield similar results. For example, if the search radius is large enough to include all of the data using Terrain Statistics, the moving average is computed with such a large search radius that the resulting grid will be a planar surface at the data average. When interpreting data metrics results, keep the gridding parameters and the data metrics calculation approach in mind.
See Also

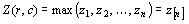
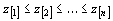 . Square brackets
indicate ordered Z values.
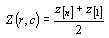
. Square brackets
indicate ordered Z values.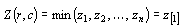


 is the mean of the selected data


 . The
list of separation distances are defined as
. The
list of separation distances are defined as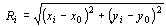
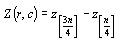
 are sorted in ascending order
and indexed as
are sorted in ascending order
and indexed as

 ,
where
,
where  is the distance
from the node to the farthest selected datum. The area over
which the density is computed is bounded by the distance to
the farthest selected datum. As such, when the data are relatively
sparse, the computed density is slightly over-stated.
is the distance
from the node to the farthest selected datum. The area over
which the density is computed is bounded by the distance to
the farthest selected datum. As such, when the data are relatively
sparse, the computed density is slightly over-stated.