For the first mapping example, we will create a hatch map. A hatch map uses colors or patterns to represent data ranges. It is one of the most common ways to display information on a map because it provides an easy-to-understand visual representation of the data. On a hatch map, all the data values are assigned to a particular class or range of data. In this example, each class is assigned a different fill color that is gradational between two or more colors. Intermediate classes are assigned gradational colors depending on where they fall in the data range.
Hatch maps use colors or patterns to represent data ranges.
As mentioned previously, thematic maps require both a base map and a data file. When you choose a thematic map command, you are required to select a boundary file and data file you would like to use. To begin creating a thematic map, simply choose the map command you want to use from the Map menu.
The following steps are for continuing the tutorial from Lesson 2.0. If you have not completed the preceding lessons, see the "Open a New Map Window," "Selecting a Map Type," and "Import a Boundary File" sections below.
1. Click the Map
| Create Map | Hatch command  to convert the base map on Layer #1 to a hatch map. The TUTORIAL.xls file
we opened in Lesson 1.1 needs to
be linked to the layer to create the thematic map. Clicking the Map | Create Map | Hatch command
opens the Open Data File
dialog.
to convert the base map on Layer #1 to a hatch map. The TUTORIAL.xls file
we opened in Lesson 1.1 needs to
be linked to the layer to create the thematic map. Clicking the Map | Create Map | Hatch command
opens the Open Data File
dialog.
2. Click the TUTORIAL.xls file in the Open Data File dialog. Notice the File name changes to TUTORIAL. Since we opened TUTORIAL.xls earlier, we can alternatively select TUTORIAL in the Use loaded worksheet: list. Click the Open button.
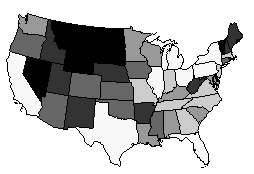
3. The TUTORIAL.xls data file is now linked to Layer #1 and a hatch map is displayed in the plot window.
4. It is good practice to name layers when using multiple layers and map types in a plot document. Rename Layer #1 by clicking on it in the Object Manager, wait a moment, then click again to enable editing. Type "Hatch Map" and press ENTER to name the layer.
Your tutorial hatch map should look similar to this map. The colors may vary depending on your settings. Changing the colors is discussed as part of Lesson 4.
If you have not completed Lessons 1 and 2, you can quickly generate a similar hatch map with the processes below.
First, open a new map window by selecting the File
| New | Plot command or clicking the  button
on the Quick Access Toolbar.
button
on the Quick Access Toolbar.
To begin creating a hatch map, click the Map | Create Map | Hatch command to display the Import dialog.
Select the TUTORIAL.gsb file in the Samples folder in the Import dialog. Next click the Open button. Click the OK button in the Import Options dialog. See Lesson 2 for more information on importing a boundary file and the associated dialog options.
Next, the Open Data File dialog is displayed, prompting you for the data file to use. Click the TUTORIAL.xls file in the Samples folder in the Open Data File dialog. Next click the OK button. See Lesson 1 for more information on opening a data file.
There is now a hatch map displayed in the plot window.
Back to Lesson 2.0 - Boundary Files