 .
.Although hatch maps are very effective for displaying data distribution, you might consider some of MapViewer's other thematic map types to display the same data. MapViewer can easily change between map types to show the same data on the map. In most cases, changing map type is as simple as selecting the type in the Map tab. For example, consider this brief exercise in which you can create a symbol map and density map with the same data.
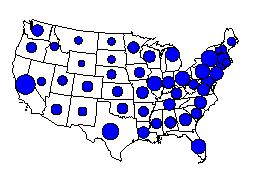
To change the hatch map into a symbol map:
1. Click
the Map
| Create | Symbol Map command  .
.

Symbol maps display variables according to symbol size.
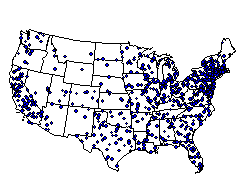
To change the symbol map into a density map:
1. Click
the Map
| Create | Density Map command  .
.

Density maps display a greater number of
symbols in areas with higher data values.
You can experiment with any of the map parameters for any of the map types you create. The most important point to keep in mind is that the location of the PID (primary ID) column in the data is the only parameter you should not change on an existing map. If you change this, the link between the map boundaries and the data is broken until you change back to the correct data column.
Often, MapViewer's default data column selections make a seamless transition between map types. However, some map types can present more than one data column, and multi-graph maps require a unique data column arrangement. You can change the data column selections in the General page of the Property Manager. Occasionally other layer properties need to be edited after changing map type to better display the map.
Back to Lesson 3.2 - Viewing the Hatch Map Data
Next to Lesson 4.0 - Editing Map Properties