In a multi-graph map, each object's graph is different than the graph for the other objects. To show a single data point for each object on a similar graph, use a line graph map. In a multi-graph map, each object has a unique XY data set that is displayed as a line graph or scatter plot. The graph is positioned in relation to the object centroid. Centroids can be moved with the Move Centroids command.
Multi-graph maps can be made for polygons, polylines, or points.
For polygons, the graphs are drawn at the polygons's centroid (geographic center). The polygons use the default fill and line properties, or you can set unique fill and line properties for each area on the map.
For polylines, the graphs are drawn at the midpoint along the polyline.
For points, the graphs are drawn directly on top of the points.
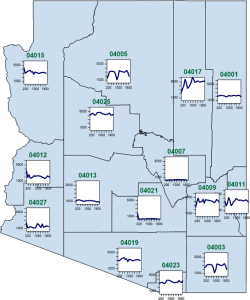
Showing monthly average gas price by state over the course of a year is an example of the type of information best displayed in a multi-graph map. Time is the x-axis of each line graph, and average gas price each month are represented by XY data points. The map shows changes in price over time in each state, and comparisons can be made between locations by comparing the separate graphs. However, X or Y data does not need to be the same for each object as the X data in this example. A multi-graph map can be used to display completely different data set for each area.
Click the Map | Create Map | Multi
Graph command  to create
a multi-graph map. Edit multi-graph map properties in the Property
Manager.
to create
a multi-graph map. Edit multi-graph map properties in the Property
Manager.
See Creating and Editing Thematic Maps for information on creating a map, changing a map to another map type, and changing map properties.
Multi-graph map data should be arranged in three columns: PID, X data, and Y data.

An example of the data worksheet
format for use with a multi-graph map.
The PID is repeated for each point in the object's data set. The above image is a small sample of the data linked to the MultiGraphMap.gsm sample file included with MapViewer.
The Property Manager for a multi-graph map contains General, Graph, Symbol, Map, Data Labels, Info, and Axes pages.
The multi-graph map graphs can be displayed as line graphs, XY scatter plots, or XY scatter plots with lines. Select a line Style in the Property Manager Graph page to display line graphs. Click the Show symbols check box, and select a Symbol in the Symbol page to display XY scatter plots. Select both a line style and symbol to display the object graphs as scatter plots with lines.
See Also