Density Map
 Density maps
use randomly positioned symbols to represent data values for areas on
a map. On a density map, each symbol represents a set number of data units,
so the number of symbols drawn in an area is proportional to the data
value associated with that area. Areas with more symbols have higher associated
data values. This type of map does not use classes like the hatch
map and can show a more continuous distribution.
Density maps
use randomly positioned symbols to represent data values for areas on
a map. On a density map, each symbol represents a set number of data units,
so the number of symbols drawn in an area is proportional to the data
value associated with that area. Areas with more symbols have higher associated
data values. This type of map does not use classes like the hatch
map and can show a more continuous distribution.
Density maps are effective at displaying data because the density of
symbols is in relation to the size of an area. For example, consider a
small area and a large area that both have the same associated data value.
Although the two areas display the same number of symbols, the symbols
are more crowded in the small area and therefore indicate the higher relative
density of data for that area.
Creating and Editing a Density Map
Select a layer with data linked boundary objects and click the Map | Create Map | Density command
 . Edit density maps in the Property
Manager.
. Edit density maps in the Property
Manager.
See Creating
and Editing Thematic Maps for information on creating a map, changing
a map to another map type, and changing map properties.
Density Map Properties
The Property Manager
for a density map contains General,
Symbol, Data
Labels, Info, and
Map
pages. Click the preceding
hyperlinks for information on properties in each of the property manager
pages.
Map Page
The Property Manager Map
page contains properties unique to density maps.
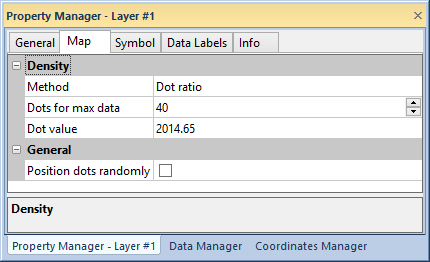
Select the density method and options in the Map
page of the Property Manager.
Symbol Values
The Density group lets you
specify the relative number of dots to draw on the map. There are two
methods you can use to create your density map. The Dot
ratio method assigns a data value to each dot, or defines a set
number of dots for the maximum data value. The Dot
sum method defines a number of dots that represent the sum total
of the variable. This method provides a simple way to make each dot represent
a percentage of the data. For example, if the total number of dots is
set to 100, each dot represents one percent of the variable.
Density settings:
The
Dot value field displays
the number of data units represented by a single dot for the Dot ratio method. This field is
linked to the Dots for max data
value. When you change the value of either field, the other is updated
accordingly. The Dot value
field is calculated by the maximum data value divided by the Dots for max data value.
You can set the Dot
value to any number, but MapViewer
might recalculate the Dot value
slightly to ensure the Dots for max
data field is an integer. Also, the Dot
value can be set to be larger than the data minimum. In this case,
the area with the data minimum does not show any dots on the density map.
Although, because of rounding, a single dot might appear in an area with
data slightly below the Dot value.
Random Positioning
Check the Position dots randomly box
to randomly position the dots each time the map is redrawn.
See Also
Legend
Property Manager