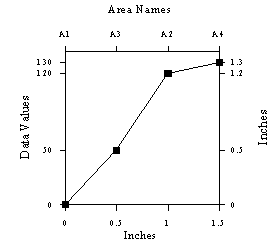
Let's say we have four boundaries, named A1, A2, A3, and A4, and their linked data values are 0, 120, 50, and 130, respectively. The Line Graph Map dialog specifies that the graph Width is 1.5 inches, the Graph height is 1.3 inches, and the Base height is 0 inches. The graph fill is yellow and profile fill is blue. After the OK button is clicked, the four boundaries are sorted in ascending order in a list according to their linked values. The order results in A1 - A3 - A2 - A4. Since the line graph is 1.5 inches wide, that leaves a horizontal gap of 0.5 inches between each data value height of the four boundaries. The shape of the line graph would look like the following graph.

The line graph is plotted on the respective boundaries as follows. Note boundary A1 does not have any yellow fill because it corresponds to a line graph height of 0 inches. The boundary with the smallest data value always has 100 percent profile fill. The boundary with the largest data value has 100 percent graph fill.
