 . Then, click the newly created legend and
move it off of the map. When you click the legend in the plot window it
is also selected in the Object Manager,
and its properties are shown in the Property
Manager.
. Then, click the newly created legend and
move it off of the map. When you click the legend in the plot window it
is also selected in the Object Manager,
and its properties are shown in the Property
Manager.When you make a thematic map, it is helpful to provide some explanation of the way in which data is represented on the map. You can easily add legends to any type of thematic map. MapViewer legends show quantitative information about the thematic map.
To add a legend:
1. Choose
the Map | Add | Legend
command . Then, click the newly created legend and
move it off of the map. When you click the legend in the plot window it
is also selected in the Object Manager,
and its properties are shown in the Property
Manager.
2. Now add a title. In the Property Manager, click the Layer tab to view the Layer page.
3. Replace the "Legend of Hatch Map" ("Legend of Layer #1") text with "United States Population" in the Text row in the Title section. Press ENTER to change the legend title.
4. Next add a fill to the legend. In the Property Manager, click the Legend tab to view the Legend page.
5. Click the Pattern selection (currently None) and select Solid from the pattern palette.
6. Click the Foreground color selection (currently Black) and select 10% Black in the color palette.
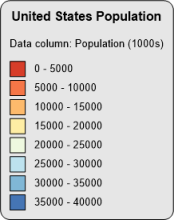
Legends display information about the map.