As mentioned previously, the primary ID is the link between the map boundaries and the data. But you might have noticed that the primary IDs are not displayed on the map. By default, the display of primary IDs is turned off. There are two methods for displaying Primary IDs on the map.
To display PIDs on the map as data labels:
1. Click on the hatch map layer in the Object Manager or click Map | Layer | Layer Properties
2. In the Property Manager, click on the Data Labels tab to view the Data Labels page.
3. Click the Show data labels check box. Notice the Label set is Column A: Primary ID. The Label Sets section is used for selecting the data column that is displayed, and multiple labels can be added to each object. For the purpose of this tutorial, we will display only the PIDs.
4. Scroll down on the Data Labels page of the Property Manager and enter "14" in to the Size (points) field of the Font Properties section.
The PID data labels are now shown on the map. Any combination of data from the worksheet can be added to the map.
Data labels can also be moved individually. We will now move some of the PIDs and add leader lines to increase our map's readability.
To move data labels:
1. Click the Start button in the Move/edit labels field to begin moving labels. The Move/edit labels field is located at the top of the Data Labels page in the General section.
2. Click and drag labels to move them. Move the northeastern states' data labels so they can be easily read. For example, move DC, MD, DE, NJ, CT, RI, and MA east off of the map. Also you can move VT and NH north.
3. Click the Finish button in the Move/edit labels field to stop moving labels. Note: You can click the Clear button next to Clear custom labels to revert the labels back to their default locations.
4. In the Leader Line - Column A: Primary ID section of the Data Labels page, click the Show check box.
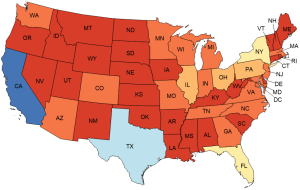
Now the hatch map has readable PIDs and lead lines have been added to the data labels. The lead lines are not visible for PIDs that have not been moved. If you have followed the tutorial up to now, your map should look similar to this:
The primary IDs can be displayed on all the map boundaries. On the
tutorial map, the states use the two-letter designations as primary IDs.
The PIDs can be quickly displayed and moved with the View | Display | Show Objects command, but the font properties cannot be edited. Leader lines cannot be added automatically to PIDs showed with the Show Objects command. For customizing PID labels, use the Data Labels page in the Property Manager. When customization is not needed, use the Show Objects command for quickly adding PIDs.