The graticule consists of grid lines that indicate the map coordinate system. The graticule lines are commonly based on latitude/longitude coordinates (as in this example), but they can also indicate any type of map coordinate system. In this example, we will add a graticule, add graticule lables, and change the graticule limits.
To add a graticule:
1. Click the Map | Add | Graticule command.
2. Click the Map | Plot | Plot Properties command to show the plot properties in the Property Manager. You can also show the plot properties by clicking empty space in the Object Manager or plot window.
3. In the Property Manager, click the Graticules tab to view the Graticules page.
4. In the General section of the Graticules page, if there is not a check mark next to Draw graticules under map check box, click the box to enable this option. Draw graticules under map is used to move the graticule behind the boundaries and other objects on the map layer. Otherwise, the graticule is drawn over the top of all boundary objects on the layer.
5. In the Y Graticules section, change the Graticule end to 50 and press ENTER.
6. In the Property Manager, click the Graticules Ticks tab to open the Graticule Ticks page. This page contains options for displaying labels and ticks on the graticule lines.
7. In both the X Graticules and Y Graticules sections, click the Show start labels check boxes.
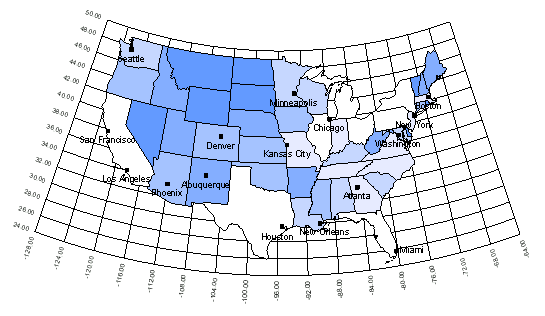
Notice that the graticule lines are curved on the map. This reflects the map projection. This map uses an Albers Equal Area projection.
Graticule lines show the map coordinate system for the map.
Back to Lesson 5.2 - Drawing Objects on the Plot
Next to Lesson 6.0 - Using Layers to Create Two Thematic Maps in One Map Window