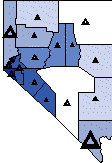
 Making
a map with different thematic maps on different layers. This way, you
can display different data variables on a "single" map. You
could show a hatch map on one layer, and a scaled symbol map on another
layer.
Making
a map with different thematic maps on different layers. This way, you
can display different data variables on a "single" map. You
could show a hatch map on one layer, and a scaled symbol map on another
layer.Layers partition a map into one or more overlays. Layers are like transparencies in that you can see all layers at the same time. Layers also let you isolate objects by placing them on separate layers. Layers are created and manipulated using the Object Manager and Map | New Layer.
Active Layer
Only one layer can be active at a time and most commands only apply to the active layer. For most commands, objects on other layers remain unaffected by any changes you make on the active layer. However, some commands do apply to all layers at the same time.
The commands that apply to all layers are:
Copy All Layers copies all objects on all map layers.
Move/Size All Layers moves all objects on all layers at the same time.
Plot Properties | Coordinate System | Change... converts the projection across all map layers.
Scale scales the boundary objects on all layers.
Calibrate converts the coordinates for all objects on all layers.
Checking the Append image check box during File | Import appends imported objects relative to all boundary objects on all layers.
File | Export exports all objects on all layers, unless otherwise specified.
One Thematic Map Per Layer
Each layer may contain a single thematic map and have only one data file associated with the layer. By using more than one layer, you can combine different map types to make multivariate thematic maps. For example, you could draw a scaled symbol map over the top of a hatch map to show two different variables. You might have a hatch map showing population and a scaled symbol map showing sales for the same areas.
Tips on Using Layers
There are several things you can accomplish when you use layers in MapViewer. When using layers, there are a few tips and tricks we can share that might help you.
If you want to move a map on the page, use the Move/Size All Layers command. This moves all objects on all layers simultaneously.
When copying a multi-layer map to the clipboard, use the Copy All Layers command. This copies all objects on all layers simultaneously.
Use "NONE" for the fill type on areas on top layers. Otherwise, filled areas or objects can obscure objects on lower layers.
Use layer names (specified in the Object Manager) to easily keep track of what you have included on each layer.
Use layers to isolate different types of objects. It is easier to select and modify objects when you do not have too many objects on a single layer.
Hatch maps work best when on the bottom layer, or a layer near the bottom, since most hatch fills obscure any maps on lower layers.
Examples
Here are some possible applications.
 Making
a map with different thematic maps on different layers. This way, you
can display different data variables on a "single" map. You
could show a hatch map on one layer, and a scaled symbol map on another
layer.
 Using
layers to emphasize particular boundaries. An example is to have two layers,
one with the county outlines and one with the state outlines. In this
situation, you can place the state boundaries on a top layer and use no
fill for the states. Then give the states a heavy line style relative
to the county boundaries.
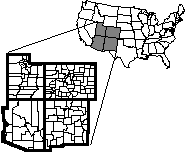
 Show
"zoomed" maps, with a small-scale map and large-scale map on
the same page. This could be used to indicate a location from the small-scale
map, and then present the data on the large-scale map.