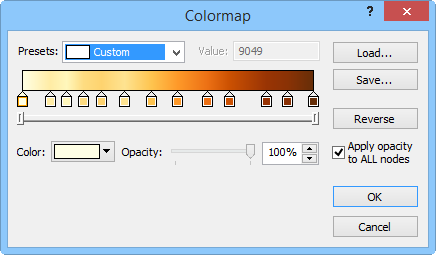
The Colormap dialog is used to assign either Preset or custom color spectrums to a map.
The colormap has specific colors assigned to nodes along the spectrum. MapViewer automatically blends colors between the nodes to produce a smooth color gradation over your map. After you create a colormap, you can save the spectrum as a .CLR file for later use with other maps. Although the colors are assigned to specific values on a map, the spectrum can be used with maps containing different Z ranges because the node values are stored as percentages. Several predefined colormaps are available in the SAMPLES directory and are shown in the Presets list.
The Colormap dialog is opened differently depending on the map type you are using to access the dialog.
Use the Colormap dialog to assign colors to a map.
The Presets list allows you to select a predefined .CLR file created by Golden Software. Custom colormaps cannot be added to the preset list.
The Value displays the data value of the node selected. The selected node may be accurately repositioned by entering a new value in the Value box. The first and last nodes cannot be changed and this control is disabled when an end node is selected.
The Value option is not used the same way with the classed post map. To determine the color in the colormap associated with each class, the following rules are used:
The first class uses the Minimum value color. This is the node on the far left side of the colormap.
Subtract the Minimum from the Maximum value and divide by the Number of classes. This is the separation value. Add the separation value to the Minimum value. This will be the value color associated with the next class.
Add the separation value to the previous value. This is the value color associated with the next class.
Repeat adding the separation value to the previous value until only the last class remains. The last class uses the Maximum value color. This is the node on the far right side of the colormap.
Surfer automatically interprets the colormap to determine the color value associated with each class. Any number of nodes can exist on the colormap. The nodes and the Value in the colormap are not associated with the classes.
The Load button opens an existing colormap .CLR file. When you click the Load button, the Open dialog is displayed with a list of colormap files. Click the file you want to use and click Open. The colormap is updated to show the colormap file settings.
Colormap files can be used with maps of varying Z ranges since the anchor nodes are stored as percentages rather than as data values. To use the exact same colors in the exact same data locations when the Z ranges vary slightly, override the default data limits and assign custom values in the Data to Color Mapping group.
Click the Save button in the Colormap dialog to create a colormap .CLR file based on the current colormap settings. When you click the Save button, the Save As dialog is displayed. Type the File name for the colormap file and click Save. The file is saved for use with other files.
The Reverse button flips the order of colors in the colormap so that colors currently associated with low data values will be mapped to high values and colors currently associated with high values will be mapped to low values. The sample colormap updates to show the new color order.
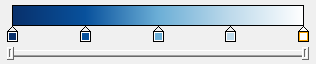
The sample of the generated colormap is display directly above the anchor nodes.
The Colormap dialog allows you to specify the colors to associate with a range of data within the map. Blended colors are achieved by creating anchor nodes along a color bar and assigning specific colors to the specified anchor nodes. Colors are linearly interpolated between adjacent anchors.
You can add additional anchor nodes at any position along the colormap. To create a new anchor node, left-click below or on the colormap where you want the new node added. The new anchor is automatically assigned a color in the color palette, and the value is displayed in the Value box. You can add as many anchor nodes as you want. This lets you blend colors in many different ways on the colormap.
Left-click on an anchor node and press the DELETE key on the keyboard to delete a node. Nodes can also be dragged outside the top or bottom of the dialog to remove it from the spectrum. The first (far left) and last (far right) anchor nodes cannot be deleted.
The scroll control appears as a horizontal bar with draggable end handles. Drag a handle left or right to zoom the colormap in or out. Drag the center section to scroll the visible portion left or right. Double-click the center section to return it to the fully visible state.

Use the scroll control to zoom the colormap in or out.
Click the Color box to specify the color of the currently selected anchor node. The color palette opens.
Change the Opacity of a node by selecting the node and entering a value from 0% (completely transparent) to 100% (completely opaque), using the arrow buttons to the right of the box, or dragging the slider to change the opacity percentage.
3D surface maps cannot be made transparent.
Click the Apply opacity to ALL nodes option to change the opacity for all nodes. Uncheck the Apply opacity to ALL nodes to change individual node opacity.
The Data to Color Mapping group contains options for setting the minimum and maximum data values to use in the colormap.
Check the Use data limits check box to use the data minimum and maximum values. This option is not available for classed post maps.
If you would prefer to set the colormap minimum and maximum values to other values, enter the new numbers into the Minimum and Maximum boxes. This is useful when you are mapping different data sets in a similar range and would like to have the same data values represented by the same colors each time. If a data value within the map falls outside this range, it is assigned the minimum or maximum color, whichever is closest.
The minimum and maximum values cannot be set for the classed post map. For the classed post map, the far left Minimum node is always the median value for the first class. The far right Maximum node is always the median value for the last class. This cannot be changed.
Check the box next to the Logarithmic scaling to set the intervals between the nodes to a log(10) scale. The Minimum and Maximum values are the same. The nodes between the minimum and maximum and the color definitions adjust to fit the log(10) scale. On a log(10) scale, there is as much distance on the colormap sample between 1 and 10 as between 10 and 100 or 100 and 1000. In the example below, the nodes are displayed at 0.1, 1, 10, 100, and 1000. To use a regular linear scale on the colormap, uncheck the box next to Logarithmic scaling.
When the Logarithmic scaling option is checked,
the color scale bar uses a Log(10) scale between nodes.
This colormap displays nodes at 0.1, 1, 10, 100, and 1000.
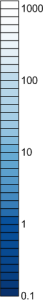
The associated color scale bar for the colormap above
is shown with the major log intervals displayed.
See Also