 . The
Data Manager can be opened or
closed by right-clicking in the Object
Manager or plot window
and selecting Managers | Data Manager
in the context menu. Click the
. The
Data Manager can be opened or
closed by right-clicking in the Object
Manager or plot window
and selecting Managers | Data Manager
in the context menu. Click the  button in the title
bar of the Data Manager to close
the window.
button in the title
bar of the Data Manager to close
the window.The Data Manager displays data or statistics associated with a selected object. If multiple objects are selected, data for only one of the objects is displayed. Use Boundary Records if you wish to view data for multiple selected objects. You can create a report or edit the data for an object in the Data Manager.
To display the Data Manager, click View | Managers | Data Manager. A check mark indicates that the Data Manager is visible. The Data Manager contains a Data view and a Stats view. To select or change the view, click the Data or Stats button.
The Data Manager is opened and
closed with the View | Managers | Object
Manager check box . The
Data Manager can be opened or
closed by right-clicking in the Object
Manager or plot window
and selecting Managers | Data Manager
in the context menu. Click the button in the title
bar of the Data Manager to close
the window.
The Data Manager can be docked on the edge of the MapViewer window or floated as a pop-up window. To change the position of the Data Manager, click on the title bar and drag it to a new location. While dragging the manager to a new location, the docking interface is shown on the screen. You can double-click on the title bar to toggle between floating and docked modes. You can drag the sides of the Data Manager to change the size of the window.
Click the Data button in the Data Manager to show the Data view. The Data view shows the data columns and data values for the object in the linked worksheet. The object type and PID are showed in the title bar.
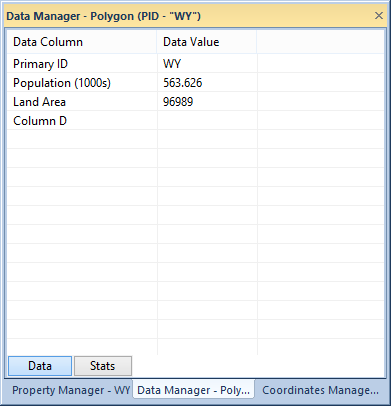
Edit data values and create new data columns in the Data view of the
Data Manager.
The Data Column section displays the column headers used in the map's data. If you do not have column headers in your data file, the column letter is displayed instead. This column is not editable. The Data Value column displays all of the data associated with the selected object. You can edit the data values by double-clicking on a data value. If you add an apostrophe ( ' ) before a number, the number is read as text as in the worksheet. Hold down the CTRL key and click in the Data Manager to add a new column of data to the worksheet. You must have an object selected to add a column.
The Stats View
The Stats view contains statistics on the selected object.
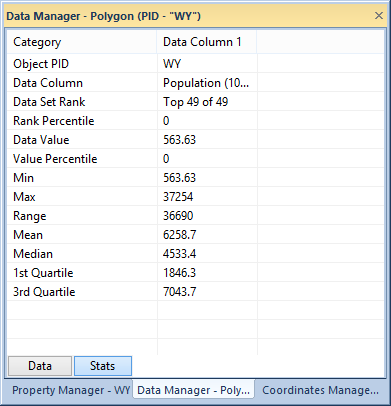
View object data statistics in the Stats view of the Data Manager.
The Category column lists all of the statistical categories available. Data Column 1 contains statistics on the first data variable. If you have a map with multiple variables, such as a pie map or bar map, the other map variables appear in the subsequent columns (Data Column 2, Data Column 3, etc). If you are obtaining statistics on a prism map object, Data Column 1 contains the height variable and Data Column 2 contains the color class variable.
To create a report of the selected object's data, right-click in the Data view to generate an Object Data Report. Right-click in the Stats view to generate an Object Statistics Report. Alternatively, the report can be generated with the Object Data Report command.
See Also