 creates counts of unique data or counts
of data within areas. The new data is added to the existing data file.
Use Home | Data | View to view
the new data.
creates counts of unique data or counts
of data within areas. The new data is added to the existing data file.
Use Home | Data | View to view
the new data.The Analysis | Data | Create Data
command creates counts of unique data or counts
of data within areas. The new data is added to the existing data file.
Use Home | Data | View to view
the new data.
When Analysis | Data | Create Data is selected, the Create Data Column dialog is opened.
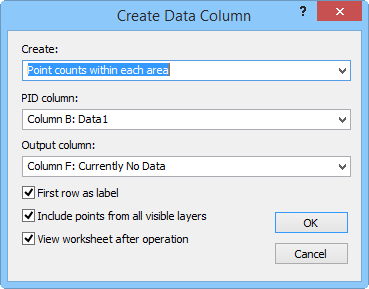
Select generated data type, PID or input column, Output column, and
options in the Create Data Column dialog.
Type of Data
Select Counts of each unique data value from input data column to create a counts of unique data. For example, if a data column contains two 37 values, the new data column would contain a "2" next to each 37 value.
Select Point counts within each area to return the number of data in each area. A new column of data is generated with the number of points for each area.
Input Column
When using Counts of each unique data value from input data column, select the data from the Input column.
PID Column
When using Point counts within each area, select the column containing area primary IDs from the PID column.
Output Column
Select a column for the new data from the Output column list. The default column is the first column without data in the data file.
Data Labels
Check the First row as label box to add a column header label to the newly created data.
Points from Visible Layers
If you wish to use points from all layers with the Point counts within each area command, check the Include points from all visible layers command.
Check the View worksheet after operation option to open the worksheet linked to the map after using the Create Data command.
Example
This is an example of data and the results. Objects "a" through "e" are points and object "z" is a polygon.
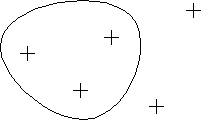
PID |
Data Value |
Counts of Each Unique Data Value |
Counts of Points within Each Area |
a |
37 |
2 |
|
b |
37 |
2 |
|
c |
16 |
2 |
|
d |
3 |
1 |
|
e |
16 |
2 |
|
z |
7 |
1 |
3 |
See Also