Limits Page
The Limits page in the plot
properties lets you define the X and Y minimum and maximum map coordinates
(specified as xMin, xMax,
yMin, and yMax
values).
When a map is created, the limits are automatically defined by the coordinate
values contained in the file used to create the map. The limits of the
selected map can be adjusted on the Limits
page of the plot properties.
Example
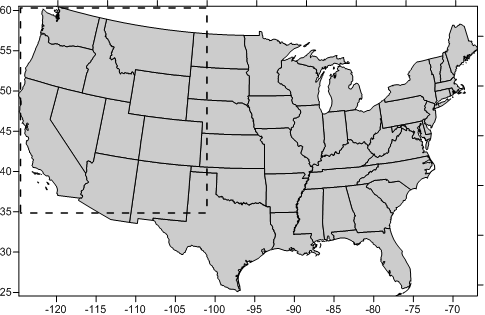
The
map limits of the map are set to the default limits as defined
by the base map.
The limits of a smaller area of interest are indicated with the
dashed rectangle. |
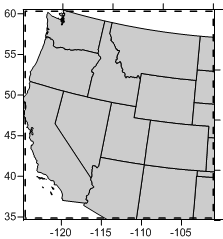
The
map limits of the map have been
adjusted to the limits of the area of interest. |
Limits and Map Scale
When new map limits are defined for a map, the map scale is not changed.
For example, if the map uses a scaling of 1 inch = 1000 meters, the new
map uses this same scale. This can result in maps much smaller or larger
than the original map. In this case, click on the map and set the new
scale on the Scale page.
Limits and Prism Maps
Prism maps are not clipped by the limits.
Limits and Post Maps
Limits can be set on post maps or maps containing a post map layer.
When a posted point lies outside the map limits, the posted symbol and
the label are clipped from the map. When a posted point is inside the
map limits, the entire symbol and posted label are printed.
If the posted point is inside the map limits but the label and/or symbol
extend beyond the map limits, the label or symbol portion outside the
map limits is clipped. Use the Edit
labels tool in the layer properties Post
page to move the label within the map limits.
Limits, Scale, and Adding Map Layers
When a new map layer is added to an existing map or a modified map layer
exceeds the current map limits, a message appears prompting you to adjust
the map limits to include all the layers. Select Yes
to adjust the map limits. Select No
to preserve the current map limits.
The Limits Page
The Limits page is located in
the plot properties.
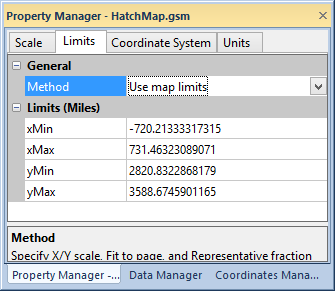
Specify the map limits in the
Property Manager
on the Limits page.
General
The Method property determines
if the limits are set by the map or user. Select Use
map limits to use the entire map limits. Select Specify limits to use user
defined limits by typing in the Limits
(Units) section below.
Limits XY Min and Max
Set custom xMin, xMax,
yMin, and yMax
map limits in the Limits (Units)
group. The units in parenthesis are the Coordinate
display units on the Units
page.
Map limits can be set larger or smaller than the limits of the current
map. For example, if you have a map that ranges from zero to 100 in the
X dimension, but you only want to display the map from 25 to 50 in the
X dimension, use 25 and 50 as the new minimum and maximum values on the
Limits page.
When using date/time formats for any of the axis labels, the minimum
and maximum on the Limits tab
are entered in date/time format. To change the value, highlight the existing
value and enter the minimum or maximum date/time value. For instance,
02/02/2014 12:00:00 AM can be entered into the xMin
option.
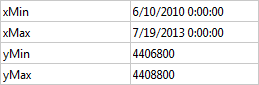
This example shows a map with
xMin and
xMax values in date/time
format.
Original Map Limits
To return to the original map limits,
choose the Use
map limits method in the Limits page.
See Also
Scale Page
Units Page
Target
Coordinate System - Map
Plot Properties