Color Classes
The Color Classes dialog is
opened when you click the Color Classes
 button on the Map page
of the Property Manager. The color
classes operate similarly to hatch map coloring.
Set the Color method to Classes to activate the Classes
button. You can categorize
the data by color, and these colors are plotted on the area prisms. The
variable used to color the prisms can be different from the variable used
for prism height (General page).
button on the Map page
of the Property Manager. The color
classes operate similarly to hatch map coloring.
Set the Color method to Classes to activate the Classes
button. You can categorize
the data by color, and these colors are plotted on the area prisms. The
variable used to color the prisms can be different from the variable used
for prism height (General page).
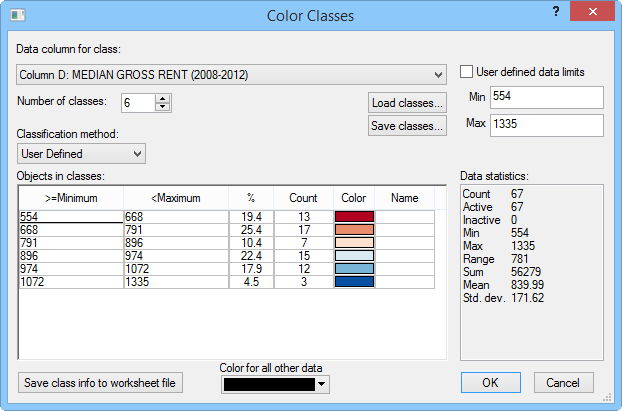
Set data classes and fill properties in the Color
Classes dialog.
Data
Select the data for prism colors in the Data
column for class list.
The list shows the available data columns from the linked data sheet.
This variable can be different from the prism height variable, so you
can show two variables at one time on the map.
Undefined Data
Color for all other data is
the color used for all areas without a corresponding data value and for
areas that contain values that do not fall in the specified classes.
Data Classes
Number of classes specifies
the number of color classes (groupings) used for the variable. Up to 100
classes can be specified.
Saving and Loading Classes
Once the classes are defined, they can be saved for reuse in a class
file [.CLS]. Click the Save Classes
button to save the classes. To use an existing class file, click the Load Classes button. You can also
save the class information to a data file by clicking the Save
Class Info to Worksheet File button.
Classification Method
The Classification method is
the method by which the class limits are calculated.
Equal Number calculates the class
minimum and maximums such that an approximately equal number of data
values fall within each class.
Equal Intervals calculates the
class limits so that the interval between the minimum value and maximum
value of each class is equal. The Increment
box is displayed when Equal Intervals
is selected, and this shows the range covered by each class.
User Defined allows you to create
your own class definitions. Overlapping or discontinuous classes are
not allowed. Double-click on the minimum and maximum values in the
class list to define the classes after you define the Number
of classes.
Standard deviation generates data
classes based on the standard
deviation of the data. When the Standard
deviation method is selected, the Increment
field appears. The Increment
field allows you to define the standard deviation increment to establish
the class ranges and number of classes. The Increment
and Number of classes values
are dependent upon each other, so changing one value automatically
changes the other.
The
Jenks' Natural breaks method
creates classes based on the optimal natural breaks in your data.
Class Information
The Objects in classes group
displays summary statistics and allows you to specify the properties for
each class.
>=Minimum and <Maximum
indicate the lower and upper limits for the class. If a data value
is greater than or equal to the minimum value and less than the maximum
value, it is plotted in the class. You can change these values by
double-clicking on a minimum or maximum value to change it in the
Class Limit dialog.
The
% column indicates the percentage
of linked data in the particular class. This value cannot be edited
and is for informational purposes only.
The
Count column indicates the
number of data included in each class. This value cannot be edited
and is for informational purposes only.
The
Color column specifies the
class's color. To change the color for a particular class, double-click
the color in the list, and select a new color in the Colors
dialog. To change the entire color spectrum, click the word Color at the top of the column
and select a new color spectrum from the Color
Spectrum dialog. Click the Custom...
button in the Color Spectrum
dialog to create a custom spectrum in the Colormap
dialog.
The
Name column indicates the
optional class title used in the legend.
Statistics
The Data Statistics box shows
data statistics for the selected variable.
Data Limits
The Set Data limits group lets
you specify the extents of the prism classes. If you would like to keep
the prism class range the same for a series of maps, even if your data
range varies between data sets, check the User
defined box and set the Min
and Max values. The minimum value
is plotted as the minimum value of the first class and the maximum value
is plotted as the maximum value of the last class. This is useful when
you would like to plot a series of maps and show the same colors at the
same classes each time. Use Map | Legend
to display a legend of the prism map class colors and values.
See Also
Prism Map
Texture Mapping
Creating
and Editing Thematic Maps
Rotate
Prism