Gradient Map
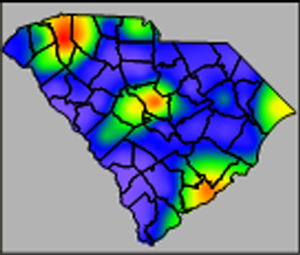 A gradient map displays
a range of colors based on information from points, polylines, and polygons.
The centroid of an polygon, all vertices of a polyline, and center of
a point are used as data point locations and the data value of the polygon,
polyline, or point is interpolated onto a grid. The gridded data values
are assigned colors based on the selected color spectrum. The resulting
map is a smooth color spectrum between the original data.
A gradient map displays
a range of colors based on information from points, polylines, and polygons.
The centroid of an polygon, all vertices of a polyline, and center of
a point are used as data point locations and the data value of the polygon,
polyline, or point is interpolated onto a grid. The gridded data values
are assigned colors based on the selected color spectrum. The resulting
map is a smooth color spectrum between the original data.
For
polygons, the data originates at the polygon's centroid
(geographic center). The color spectrum blends across area boundaries.
If you would rather have a discrete colors for each area, use the
hatch map instead.
For
polylines, the data originate at all vertices on the polyline. The
color gradient is drawn in a rectangular shape that encompasses all
the polylines.
For
points, the data originate directly on top of the points. The color
gradient is drawn in a rectangular shape that encompasses all the
points.
Creating and Editing a Gradient Map
Click the Map | Create Map | Gradient
command  to create a gradient map. Edit gradient
map properties in the Property
Manager.
to create a gradient map. Edit gradient
map properties in the Property
Manager.
See Creating
and Editing Thematic Maps for information on creating a map, changing
a map to another map type, and changing map properties.
Gradient Map Properties
The Property Manager
for a gradient map has General, Gridding,
Data Labels, Info,
and Map pages. Click the preceding
hyperlinks for information on properties in each of the property manager
pages.
Map Page
The Map page in the Property
Manager for a gradient map controls the color mapping method, data
limits for colors, color spectrum, and boundary options.
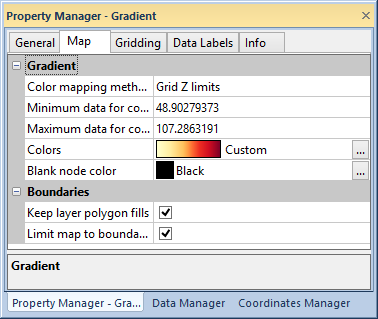
Edit gradient map properties in the Map
page of the Property Manager.
Gradient
Color and data options for the gradient map are in the Gradient
section of the Map page. Select
Worksheet data limits, Grid Z limits, or User
defined from the Color mapping
method list. Selecting Worksheet
data limits sets the Minimum
data for colors and Maximum data
for colors fields to the minimum and maximum data values in the
linked worksheet. The Grid Z limits
method sets the Minimum data for colors
and Maximum data for colors to
the minimum and maximum grid limits.
Type a value into the Minimum data
for colors or Maximum data for
colors to set user defined color limits. Adjusting the data limits
automatically changes the Color mapping
method to User defined.
The Colors property sets the
color spectrum used in the gradient map. Click the current color spectrum
to select a preset color spectrum. Click the  button
to create a color spectrum in the Colormap
dialog.
button
to create a color spectrum in the Colormap
dialog.
Select a color for blank nodes and nodes outside the Minimum
data for colors and Maximum data
for colors range in the Blank
node color list. Click the current color to select a color from
the color palette. Click
the button to select a color or create a custom
color in the Colors dialog.
Boundaries
The Boundaries group on the
Map page contains options for
gradient map boundaries. Click the Keep
layer polygon fills check box to show fills from polygons on the
gradient map layer on top of the gradient map fill.
Click the Limit map to boundaries
check box to limit the gradient map fill to the boundaries on all layers.
When Limit map to boundaries
is not checked, the gradient map fills the
for the objects on all layers.
See Also
Legend
Property Manager