Digitize
The Home | Data | Digitize
command  allows you to write map coordinates to a
data file. As you move the pointer across the selected map, the X and
Y map coordinates for the current mouse position are shown in the status
bar. Left-click on a map to write digitized points to the Digitized
Coordinates dialog.
allows you to write map coordinates to a
data file. As you move the pointer across the selected map, the X and
Y map coordinates for the current mouse position are shown in the status
bar. Left-click on a map to write digitized points to the Digitized
Coordinates dialog.
Digitized Coordinates Window
Click the Home | Data | Digitize
command to enter into digitize mode. Left-click
on a map, and the Digitized Coordinates
window is displayed.
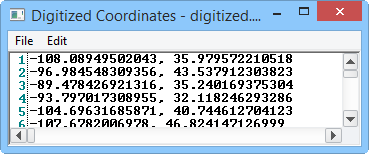
The digitized X and Y values are written to
the Digitized Coordinates window.
The coordinates for the clicked point are written to the Digitized
Coordinates window. Each time the map is clicked, a small, temporary
red symbol is drawn on the map, and the map coordinates for the current
mouse position are written to the Digitized
Coordinates window. In this way, you can digitize boundaries from
maps and easily create boundary files from the digitized information.
You can also create a blanking
file with Map | Digitize.
The Digitized Coordinates window
stays open until it is closed by clicking the  button
in the top right corner of the Digitized
Coordinates window. This allows convenient editing of the
data and allows digitizing to start and stop multiple times and be recorded
in the same window.
button
in the top right corner of the Digitized
Coordinates window. This allows convenient editing of the
data and allows digitizing to start and stop multiple times and be recorded
in the same window.
Menu Commands
The Digitized Coordinates window
has two menus: File and Edit.
File
The File menu allows you to
save or open an ASCII .DAT data file or Golden Software boundary .BLN
file.
Edit
The Edit menu command allows
for common editing, such as undo, redo, cut, copy, paste, delete, find,
replace, and select all. These commands work in much the same way as the
Clipboard, Undo,
and Tools commands in the Home
tab for a worksheet.
Digitizing Information from a Map
To digitize information from a map, follow these steps:
Create a map in the plot
window and select the map.
Choose the Home
| Data | Digitize command . The cursor
becomes a cross hair to indicate digitize mode.
As you move the cross
hair cursor within the plot window, the map coordinates for the position
are displayed in the status
bar.

The status bar displays
the X and Y coordinates before you click on the map.
Click the left mouse button
in the plot window to write the current coordinates to the Digitized
Coordinates window. Continue adding points in this manner.
Digitized points appear as temporary small red plus-signs on the map.
When you are finished
using the Digitize command,
click on any tool button or command, or press the ESC key on the keyboard.
To save the data in the
Digitized Coordinates window,
click the File | Save As command
in the window. You are prompted to save the data as Boundary Files (*.bln) or Data
Files (*.dat). Type a File
name and click Save
to save the data. Click Cancel
to not save the data and return to the Digitized
Coordinates window.
Click the
button in the top right corner of the window to close the Digitized
Coordinates dialog. The dialog will stay open until closed
in this manner.
Coordinate System Information
If the map that you are digitizing from
is referenced with a coordinate system on the Coordinate
System page, the digitized .BLN or data file automatically creates
a .GSR2 file. The points digitized and the .GSR2 file contains the map's
target coordinate
system information. This is the map's coordinate system, not the map
layer's coordinate system.
See Also
Base Map