 to display data
associated with the boundary objects in the region after you have defined
regions with one of the Draw | Region
commands. The report can be edited, saved, and printed in the report window.
to display data
associated with the boundary objects in the region after you have defined
regions with one of the Draw | Region
commands. The report can be edited, saved, and printed in the report window.You can choose the Analysis | Data
| Records in Regions command to display data
associated with the boundary objects in the region after you have defined
regions with one of the Draw | Region
commands. The report can be edited, saved, and printed in the report window.
The Data Records in Specified Zone dialog shows summary information about the selected boundary objects from the data file used to create the map.
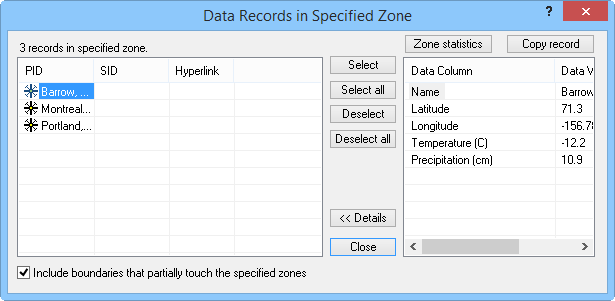
Generate reports on records in a region or statistics reports on data values for an entire region in the
Data Records in Specified Zone dialog.
Region Objects
The left side of the dialog displays a list of the records in the region(s) defined with the Draw | Region commands. This list shows the IDs for the selected boundary objects. The number of selected boundary objects is indicated above the list.
Selecting Objects
When you select a primary ID from the list, you can click the Select button to select that object on the map. This helps you to locate the position of individual boundary objects on the map after the Data Records in Specified Zone dialog is closed. If you select another boundary object from the list and click the Select button, the original boundary object remains selected and the next boundary object becomes selected as well.
The Select All button allows you to select all the boundary objects within the selection region. For example, you might want to assign symbol properties to all the pins in the selection region on a pin map. You can click the Select All button, click the Close button, and then use the Property Manager to set the symbol properties for all the selected boundary objects. You could also obtain the data associated with the selected objects using the Boundary Records command.
Deselecting Objects
Click on a primary ID name and then click the Deselect button to deselect the object when the dialog is closed. To deselect all objects, click the Deselect All button or click in the map window anywhere outside the limits of selected boundary objects.
Details
Clicking the Details button expands the dialog so you can view data information for each of the selected boundary objects. Data are organized by showing the data file column header on the left, and the associated data value on the right. To view data for a particular boundary object, click on the primary ID for that boundary object. The data is displayed on the right side of the dialog. As you click different IDs, the data are updated to show information for the selected boundary object. If you need to change the data, select the boundary, click the Close button, and change the data in the Data Manager.
Statistics
When a particular data field is selected, you can click the Zone Statistics button to open the statistics report. This provides you with statistical information based on the selected field for all the selected boundary objects.
Copy Record
You can use the Copy Record button to display an object data report for the selected object. Once this report is generated, you can copy, save, or print the information for the selected boundary object.
Include Partial Boundaries
If the Include boundaries that partially touch the specified zones box is checked, objects that partially touch the region or zone are included in the record count and list.
See Also